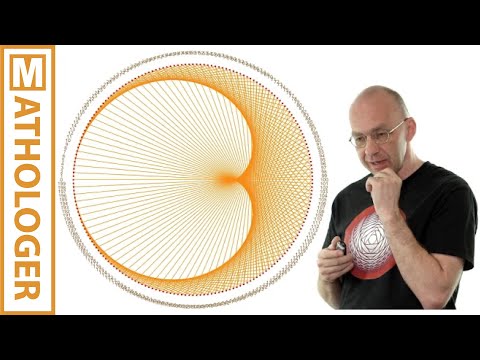
Times Tables, Mandelbrot and the Heart of Mathematics
In brief
Mathologer shows how times table diagrams on a circle produce cardioids and other curves connected to the Mandelbrot set. He explains the patterns and links to a tool for making your own diagrams.